This is a performance measure page that allows a user to execute and to test and log the time taken from their local machine, to the web server, to the application server, to the database server and then back through each server returning to the local desktop. This will be used to determine when there is an application code problem or a user environment problem.
Click ![]() alongside System Logs on the sub-menu on the left. Additional options will be displayed.
alongside System Logs on the sub-menu on the left. Additional options will be displayed.
Select General Error Log from the sub-menu on the left. The Error Log Report screen will be displayed.
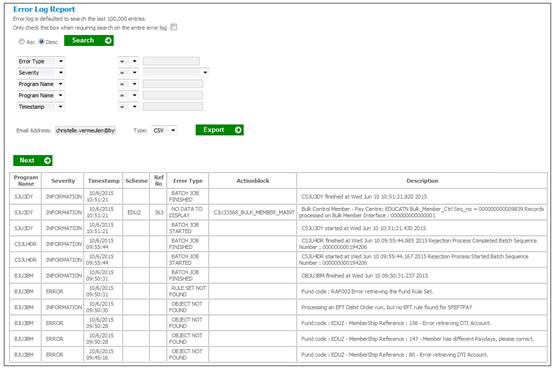
The following columns are displayed:
- Program Name
- Severity
- Timestamp
- Scheme
- Reference Number
- Error Type
- Action Block
- Description
Also refer to
Reports
General
Error Log Report
Select Income Master Log from the sub-menu on the left. The Master Log screen will be displayed.
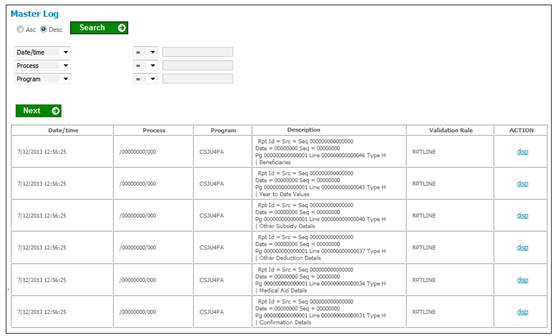
The following columns are displayed:
- Date/time
- Process
- Program
- Description
- Validation Rule
- Action
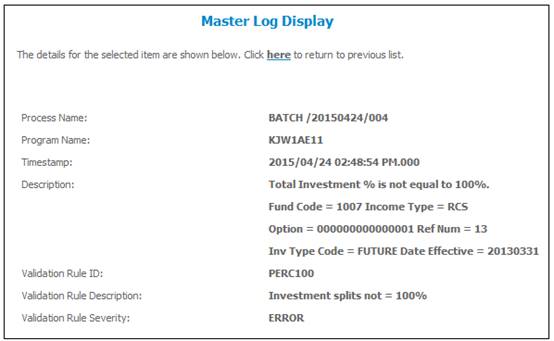
To display details of a log click the hyperlinked dis in the Action column alongside the log.
The Master Log Display screen will be displayed.
Refer to
Processes
Contributions
Income
General
Master Log
Select Technical Log from the sub-menu on the left. The View Logs screen will be displayed.
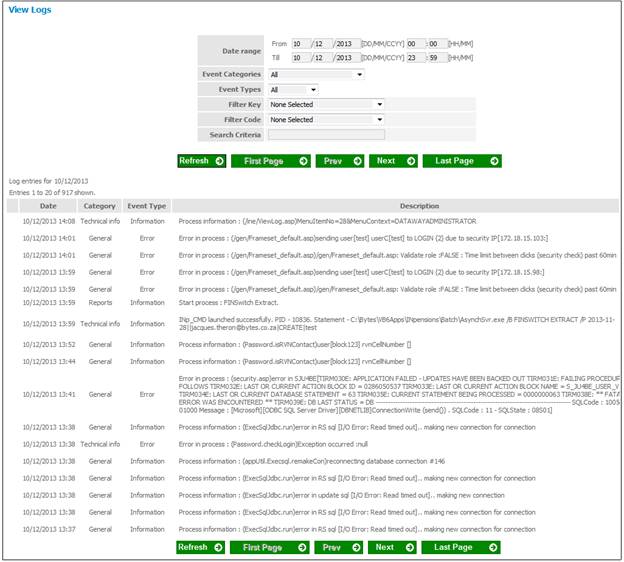
The following columns are displayed:
- Date
- Category
- Event Type
- Description
To display more detailed information click + on the left of the log.
The screen expands to display the message details.
Example:

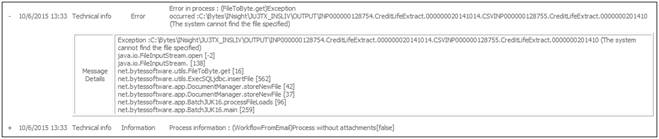
To close the message details click - on the left of the log.
Refer to
Processes
File Transfer
File Layouts
Payroll
Select Archive Log from the sub-menu on the left. The Archive Status Log screen will be displayed.
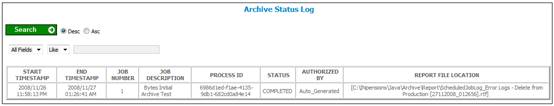
The following columns are displayed:
- Start Timestamp
- End Timestamp
- Job Number
- Job Description
- Process ID
- Status
- Authorized By
- Report File Location
Refer to Status Log under Archiving.