This functionality provides an accurate statistical analysis for each process. These statistics are displayed in real time and continuously updated so that the latest position is always displayed.
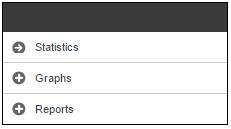
Select Statistics from the sub-menu on the left.
The My Work Statistics screen is displayed.
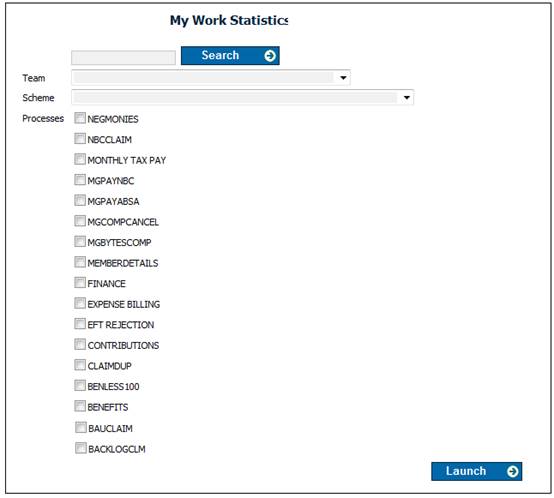
This screen allows the user to specify which statistics must be displayed.
Capture data as follows:
|
SEARCH |
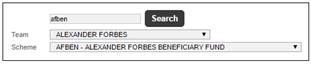
To display statistics for a specific scheme, capture the scheme code in the first field and click SEARCH.
Note: The system will display the Team and Scheme fields associated with the scheme code captured.
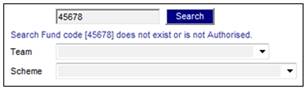
If the scheme code captured is not found or is not authorised, the following message will be displayed:
Search Fund code [code] does not exist or is not Authorised.
|
|
Team |
Select a specific Team for which statistics should be displayed from the drop-down list.
A selection is mandatory. |
|
Scheme |
If statistics should be displayed for all schemes associated with the Team selected, then do not make a selection from the drop-down list.
If statistics should be displayed for a specific scheme associated with the Team selected, then select a scheme from the drop-down list.
Note: If you performed a successful search on a specific scheme then this selection has already been made. |
|
Processes |
Tick the appropriate box for the Process for which statistics should be displayed.
More than one box may be ticked. |
Click LAUNCH.
A screen will display a set of statistics per Process for the scheme(s) specified.
If more than one Process was selected, the system will automatically switch between the display of each Process in sequence. The length of time that each Process is displayed is defined on the system, e.g. every 300 seconds (5 minutes).
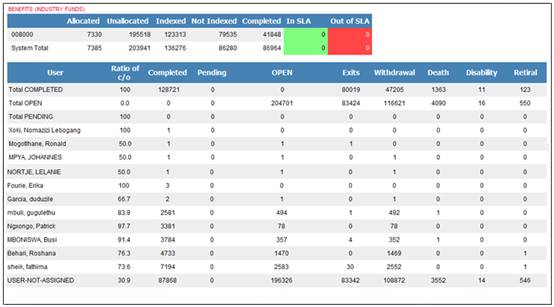
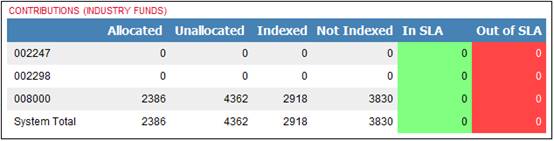
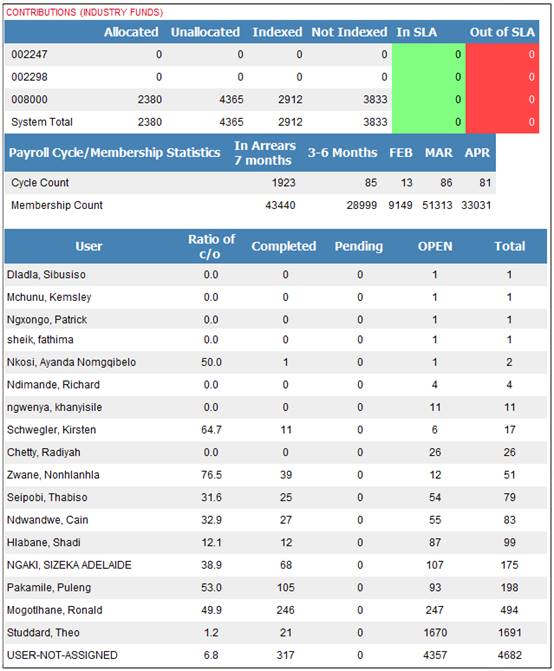
Allocated / Indexed / SLA statistics
All Processes will have statistics displayed in the following columns for Service Requests:
Allocated
Unallocated
Indexed
Not Indexed
Completed In SLA
Out of SLA
The upper part of the screen displays the following:
The Process and Team / Scheme selected. E.g. ![]()
Scheme row: An analysis for the selected Process per scheme.
![]()
System Total row: An analysis for the selected Process, for the total of all schemes.
![]()
This allows the User to easily compare the totals for the Team versus the totals for all Teams for the selected Process.
The following columns are displayed in this analysis:
|
Allocated |
The number of Service Requests allocated to a User. |
|
Unallocated |
The number of Service Requests not yet allocated to a User. |
|
Indexed |
The number of service requests for which all of the required fields have been captured, and therefore can be processed. |
|
Not Indexed |
The number of service requests where either scheme code / reference number or the scheme code / pay centre have not yet been captured, and therefore cannot be processed. |
|
In SLA |
The number of service requests where the service request is still within the SLA defined but is in danger of exceeding it. |
|
Out of SLA |
The number of service requests where the service request exceeds the SLA defined. |
Additional statistics will be displayed on the lower part of the screen for Benefits Process Users.
The following columns are displayed:
|
User |
The name of each User. |
|
Ratio of C/O |
The ratio describes the percentage of “Open” service requests against the total number of service requests received. Example:
Completed: 296 Open: 80
296 / (296 + 80) x 100 = 78.7 |
|
Completed |
The number of Benefit Service Requests with an Activity Status of COMPLETED. |
|
Pending |
The number of Benefit Service Requests with an Activity Status of PEN (Pending). |
|
Open |
The number of Benefit Service Requests with an Activity Status of OPEN. |
|
Exits |
The number of Benefit Service Requests for Exits. |
|
Withdrawal |
The number of Benefit Service Requests for Withdrawal. |
|
Death |
The number of Benefit Service Requests for Death. |
|
Disability |
The number of Benefit Service Requests for Disability. |
|
Retiral |
The number of Benefit Service Requests for Retiral. |
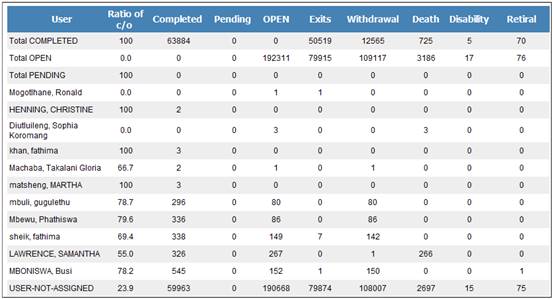
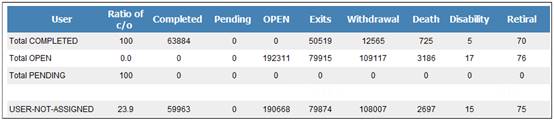
Additional Data
In addition to the statistics displayed for each User, the following information is displayed:
Total COMPLETED
Total OPEN
Total Pending
USER-NOT-ASSIGNED
The following additional statistics will be displayed on the lower part of the screen for Contributions Process Users.
Payroll Cycle / Membership Statistics
User Statistics
Payroll Cycle / Membership Statistics
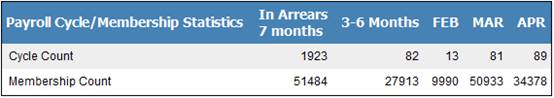
The following columns are displayed:
|
Payroll Cycle / Membership Statistics |
This column consists of 2 rows: Cycle Count Membership Count |
|
In Arrears 7 months |
The number of Cycles with the membership count that have not been processed for more than 6 months. |
|
3 – 6 months |
The number of Cycles processed with the membership count for the last 6 months (inclusive of the 3 months displayed). |
|
By Month (last 3 months) |
The number of Cycles processed with the membership count for each of the last 3 months. |
User Statistics
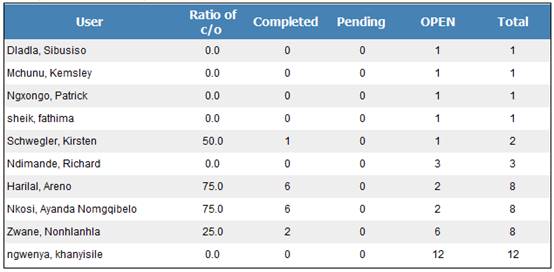
The following columns are displayed:
|
User |
The name of the Contributions Process User. |
|
Ratio of C/O |
The ratio describes the percentage of “Open” service requests against the total number of service requests received. Example:
Completed: 60 Open: 20
60 / (60 + 20) x 100 = 75.0 |
|
Completed |
The number of Service Requests with an Activity Status of COMPLETED. |
|
Pending |
The number of Service Requests with an Activity Status of PEN (Pending). |
|
Open |
The number of Service Requests with an Activity Status of OPEN. |
|
Total |
The total number of service requests per User with an Activity Status of OPEN, PEN (Pending) or COMPLETED. |